 By Aidan Sowa · October 2026 · Elmhurst, Illinois
The honest answer is that no source in the Elmhurst materials documents a guaranteed direction, and any report that promises one is going beyond its evidence. What can be documented is the balance of pressures entering the next period. On the side supporting prices, Elmhurst recorded a median sale price of $697,500 in September 2026, with 26.7 percent of sales paid in cash and 14 median days on market (Realty.com, 2026). A county update put the median at $697,039 in August 2026 (Redfin, 2026). Of the 12 older houses assembled for this report, builders were the buyers in 10 cases (Frontier Capitals, 2026). Those are signs of demand meeting a fixed supply of village lots.
On the side pressing against prices, sellers face interest rate and construction lending conditions that can cool both household and builder budgets (Federal Reserve, 2025). Regional housing conditions in the Chicago area can soften as well as strengthen (Federal Reserve Bank of Chicago, 2026). The expectation that best fits the evidence is therefore not a confident rise or a confident fall. It is a market where Elmhurst prices are supported by scarcity and builder demand, exposed to credit conditions, and likely to be decided house by house and lot by lot rather than by a single village wide swing. For a seller, that means the present documented level matters more than a directional guess.
Key Findings
- The Elmhurst median was $697,500 in September 2026 and $697,039 in August 2026, two close readings from separate snapshots (Realty.com, 2026; Redfin, 2026).
- Builders acquired 10 of 12 sampled older homes, a demand rate of 83.3 percent that supports lot values (Frontier Capitals, 2026).
- Averaged across the sample, older houses reached 26.6 percent of the amounts paid for newly built homes on similar lots (Frontier Capitals, 2026).
- New construction on standard Elmhurst lots has sold in the $1,300,000 to $1,700,000 range, anchoring the residual math for older lots (Redfin, 2026).
- National single family starts ran at 918,000 at a seasonally adjusted annual rate in August 2026 (National Association of Home Builders, 2026).
- Illinois housing inventory and price pressure research describes tight supply conditions behind current prices (DePaul University, 2026).
Which forces are holding Elmhurst prices up?
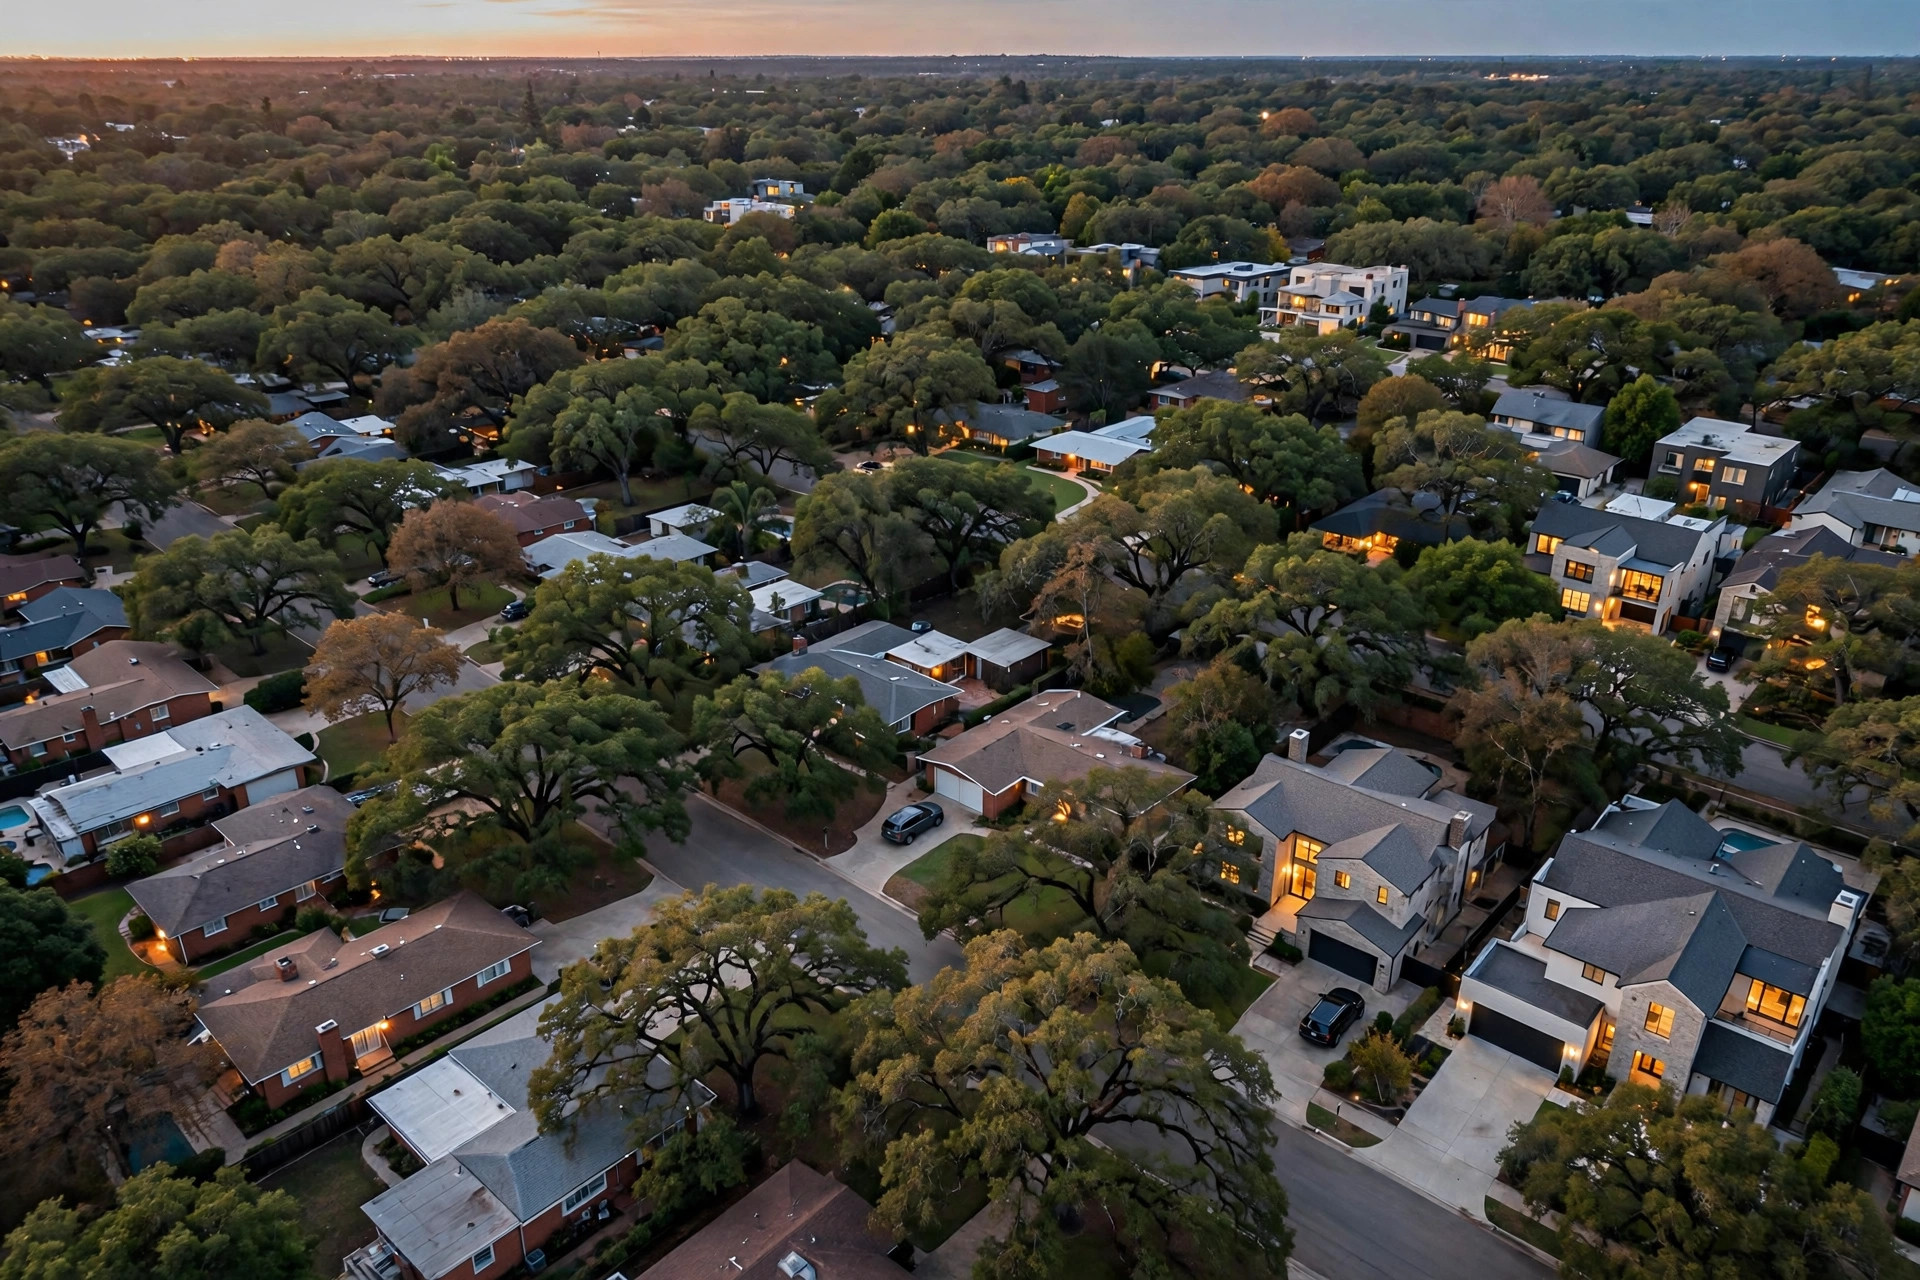
Supply is the first force, and it is structural. Elmhurst is an established village in DuPage County with standard lots of about a quarter acre and a sample minimum lot of 7,365 square feet (Frontier Capitals, 2026). The desirable ground, near downtown Elmhurst, inside the York District, and along established streets, is already built on, largely with 1950s to 1970s ranches and split levels. Housing characteristics for DuPage County describe a mature housing stock rather than a frontier of empty lots (U.S. Census Bureau, 2025). When demand rises in a place where lots cannot be added, price does the adjusting.
Builder demand is the second force, because it creates a floor buyer for the older stock. In the sample, the builder acquisition rate was 83.3 percent (Frontier Capitals, 2026). Builders such as those maintaining active pipelines across the village acquire older homes and deliver $1,300,000 to $1,700,000 new homes on the same lots, according to local reporting in the research file (Redfin, 2026). The residual illustration makes the support concrete, as a simplified example and not a promise: a $1,500,000 new build sale, minus roughly $600,000 in hard and soft construction costs and a builder margin near 20 percent, leaves a residual land value around $575,000 to $650,000 before $20,000 to $35,000 in site preparation. A buyer whose math leaves that much room for land does not disappear because of one soft month in the median.
Household demand is the third force. A cash share of 26.7 percent signals buyers who can close without depending entirely on mortgage timelines (Realty.com, 2026). Fourteen median days on market in that snapshot signals that well priced Elmhurst homes were not waiting long for a buyer in September 2026 (Realty.com, 2026). Parcel records confirm the physical side of that demand, lot dimensions, zoning, and assessed land values for the parcels buyers are competing for (DuPage County Assessor, 2026). Inventory research for Illinois, describing pressure from limited listings, aligns with those local signals (DePaul University, 2026).
National building activity is background support rather than a local guarantee. Single family starts at 918,000 in August 2026 show builders nationally still committing capital to new homes (National Association of Home Builders, 2026). In Elmhurst that national posture shows up locally as competition for older homes on buildable lots. Owners who want to see the timing side of these forces can read the report on whether now is a good time to sell a house in Elmhurst.
Which forces could push Elmhurst prices down?
Credit is the clearest downward force. Interest rate and construction lending conditions shape what a household can borrow and what a builder can finance (Federal Reserve, 2025). If borrowing becomes more expensive or harder to obtain, some household buyers reduce their bids or leave the market, and some builders lower land bids to protect their margins. Regional reporting from the Chicago Fed tracks those conditions as they develop across the district that includes DuPage County (Federal Reserve Bank of Chicago, 2026). No seller can schedule around that risk with confidence, because the same conditions can also ease.
Finished price softness would be the second force, because Elmhurst lot values are derived from new build outcomes. New construction has sold from $1,050,000 to $1,900,000 in 2025 to 2026 (Redfin, 2026). If the lower end of that range became the norm on standard lots, the residual available for land would shrink, and builder bids for older homes would follow it down. The sample ratio, older homes at 26.6 percent of new build prices, would then apply to a smaller denominator (Frontier Capitals, 2026). This is the channel through which a national or regional weakening would actually reach an older home on an Elmhurst side street: not through the median headline first, but through the builder calculation for that lot.
Seller behavior can add local pressure even in a stable village market. If many owners list at once after a period of waiting, buyers gain choice and concessions grow. If owners price from the highest new build headline rather than from comparable older home sales, homes sit, and sitting homes invite reductions. The documented listed experience for older Elmhurst homes, 60 to 120 plus days from first showing to funded close and 90 to 180 days including market time, shows that overpricing is punished with time even when the village median is firm. Price direction for a specific house is therefore partly chosen by its seller at the moment of pricing.
There are also parcel specific downward forces that no village forecast captures. A home along Salt Creek or a tributary can face floodplain questions that affect insurance and buyer math. A home with deferred systems can face repair credits of $10,000 to $30,000 after inspection on the listed route. Those factors can move one Elmhurst price down while the street around it holds steady, which is another reason a single rise or fall answer misleads.
What do the two medians close together actually suggest?
Two snapshots landing near the same level, $697,039 in August and $697,500 in September, suggest steadiness at the moment they were taken, not momentum in either direction (Redfin, 2026; Realty.com, 2026). A median is a middle closing, not a price index for the same house sold twice, so a small move between months can reflect which homes happened to close rather than a change in the value of any given home. New construction closings lift a median. Older home closings lower it relative to new builds. A month heavy with $1,300,000 to $1,700,000 new sales will read higher than a month heavy with $400,000 older home sales, even if neither group changed price at all (Redfin, 2026).
That composition warning matters in Elmhurst more than in a uniform subdivision market, because the gap between the two Elmhurst products is unusually wide. The builder trade operates at roughly double the citywide median at the finished end, while older homes in the sample changed hands near $400,000 against a $1,500,000 new build example (Frontier Capitals, 2026). Watching the median alone can therefore hide the two movements a seller actually cares about: what households pay for livable older homes, and what builders pay for lots. Recent sold records separated by property type give a clearer view than the blended headline (Redfin, 2026).
For owners tracking their own position, the useful habit is to follow comparable sales on their own street and in their own segment, confirm lot and zoning facts in the assessor record, and treat village medians as weather rather than as a valuation (DuPage County Assessor, 2026). The longer price history is covered in the report on how much Elmhurst home values have changed in 2026, and the forward speculation is tested in the analysis of whether Elmhurst home prices will drop in 2027.
How should a seller act if the direction is genuinely uncertain?
Uncertainty argues for comparing documented nets rather than for waiting for a clearer forecast, because a clearer forecast may arrive only after prices have already moved. On the listed route at $400,000, commission at 5 to 6 percent removes $20,000 to $24,000, seller closing costs add 1 to 2 percent, concessions and credits on older inventory run from $8,000 to $30,000 depending on the stage, and carrying costs over three to six months add $10,000 to $25,000, leaving the seller in the low to mid $300,000s. That ledger is known today. It does not depend on whether prices rise or fall next year, except that a fall would lower the gross to which the percentages apply and a rise would lift it.
Frontier Capitals offers the direct comparison for Elmhurst owners, as a firm that sources off market deals to builders and buys with its own capital without presenting itself as a builder. Its five terms matter most when direction is unclear, because they lock in the cost side. Privacy is protected, with no showings, no open houses, and no public marketing period exposing the household plans. Closing is flexible, in 7 to 21 days when a seller wants to move before conditions change, or months out with a leaseback when the household needs time. No commission is charged, preserving the $20,000 to $24,000 that a listed $400,000 sale would lose. No seller closing costs are charged, preserving the typical 1 to 2 percent. The house is taken as it stands, with no inspection repair demand of $10,000 to $30,000 reopening the price.
A seller who believes prices will rise strongly may still choose to list and wait for that rise, and this report does not claim that choice must fail. A seller who believes prices may fall, or who cannot afford to be wrong, has a documented present to act on. Between those positions sits the largest group: owners who expect to sell at some point and gain little from directional risk. For them, the question is less rise or fall in the abstract and more whether their own house, on its own lot near downtown Elmhurst or in the York District or along the Salt Creek Corridor, already commands a price they would accept after costs. The market balance question behind that judgment is examined in the report on whether Elmhurst is currently a buyer or seller market.
Verification remains the seller protection in any direction. Proof of funds in the buyer name dated within the last 30 days, recorded deeds in the buyer entity name, and a meaningful earnest money deposit forfeited on a walk away distinguish a buyer who can close at the agreed price from one who is hoping conditions improve. County housing characteristics and parcel data can confirm the factual claims made about a lot (U.S. Census Bureau, 2025; DuPage County Assessor, 2026). A price agreed with a verified buyer is a fact. A forecast, however confident, is not.
Methodology and limitations
This report is grounded in the sample compiled for this study: 12 older homes in 60126, 10 acquired by builders, an average older home price of 26.6 percent of new build prices, a minimum lot of 7,365 square feet, and a rank of 78th of 189 (Frontier Capitals, 2026). Elmhurst market levels come from the September 2026 snapshot and the August 2026 county update (Realty.com, 2026; Redfin, 2026). Credit and regional conditions are drawn from federal sources (Federal Reserve, 2025; Federal Reserve Bank of Chicago, 2026). Building activity, inventory research, and county housing data provide context (National Association of Home Builders, 2026; DePaul University, 2026; U.S. Census Bureau, 2025).
The limits are central to the answer. The sample is not a census, medians blend unlike homes, and no source in this set publishes a forecast that Elmhurst prices will rise or fall by any stated amount. This report therefore describes pressures and documents current levels rather than predicting a direction. Residual land values are simplified illustrations, not offers. Individual prices will vary with lot, block, condition, and flood position, and a specific Elmhurst home can move against the village pattern for reasons only a property level review can establish.
Conclusion
Elmhurst prices are expected, on the documented evidence, to be contested rather than settled in one direction: scarcity of village lots, an 83.3 percent builder acquisition rate in the sample, cash in 26.7 percent of sales, and new build prices in the $1,300,000 to $1,700,000 range support current levels, while credit conditions and any softness in finished prices could press them down (Frontier Capitals, 2026; Realty.com, 2026; Federal Reserve, 2025). That balance is why sellers should decide from their own net proceeds and timing needs rather than from a promised rise or a feared fall.
Owners who want that balance tested against a specific Elmhurst address can call Frontier Capitals at 401-219-4207 or write to [email protected]. The firm will show the household and builder readings for the property and the net each route would leave today.
When the evidence supports your price today but cannot promise it tomorrow, how much certainty are you willing to trade for a possible gain?
Frequently Asked Questions
Are Elmhurst prices rising right now?
The two most recent medians in this set, $697,039 in August 2026 and $697,500 in September 2026, are nearly level (Redfin, 2026; Realty.com, 2026). They suggest steadiness at the time taken, not a proven rise, and medians shift with the mix of homes closing.
What is the strongest support under Elmhurst prices?
Builder demand for a fixed supply of lots. Builders acquired 10 of 12 sampled older homes, and finished new homes on standard lots sell in the $1,300,000 to $1,700,000 range, which supports residual land values (Frontier Capitals, 2026; Redfin, 2026).
What could cause Elmhurst prices to fall?
More expensive or tighter credit for households and builders is the clearest documented pressure, tracked in federal lending and regional conditions reporting (Federal Reserve, 2025; Federal Reserve Bank of Chicago, 2026). Softer finished new build prices would also lower what builders can pay for lots.
Does a fall in the median mean my house lost value?
Not necessarily. The median blends new construction up to $1,900,000 with older homes near $400,000, so a change in the mix of closings can move the median while your segment holds steady (Redfin, 2026). Comparable sales for your own house type are the better check.
Should uncertainty about direction delay my sale?
For owners who already intend to sell, uncertainty usually argues for comparing documented nets now rather than waiting for a forecast that may never be firm. Holding costs and listed sale costs apply in either direction.
Sellers in Elmhurst also ask What Happens If a House Has Negative Equity During Divorce in Elmhurst?, Can a House Be Sold Without Making Repairs During Divorce in Elmhurst? and Is Spending $50,000 on Renovations Profitable Before Selling in Elmhurst?
Sources
- Frontier Capitals, 2026. 189 neighborhood builder demand study: 12 homes sampled in 60126, 10 acquired by builders, average older home price 26.6 percent of new build, minimum lot 7,365 sq ft, ranked 78th of 189. Market data.
- Realty.com, 2026. Elmhurst housing market snapshot, September 2026: median sale price $697,500, 26.7% paid in cash, 14 median days on market. Market data.
- Redfin, 2026. DuPage County housing market update, August 2026: Elmhurst median sale price $697,039. Market data.
- Redfin, 2026. Recently sold homes and new construction, ZIP code 60126, Elmhurst IL. Market data.
- Federal Reserve Bank of Chicago, 2026. Regional housing market conditions. Government data.
- Federal Reserve, 2025. Interest rate and construction lending conditions. Government data.
- National Association of Home Builders, 2026. Single-family starts at 918,000 seasonally adjusted annual rate, August 2026. Industry report.
- DePaul University, 2026. Institute for Housing Studies, on inventories and price pressure, via Illinois REALTORS. Research institute.
- U.S. Census Bureau, 2025. American Community Survey housing characteristics, DuPage County, Illinois. Government data.
- DuPage County Assessor, 2026. Parcel dimensions, zoning classifications, and assessed land value records for 60126. Official record.